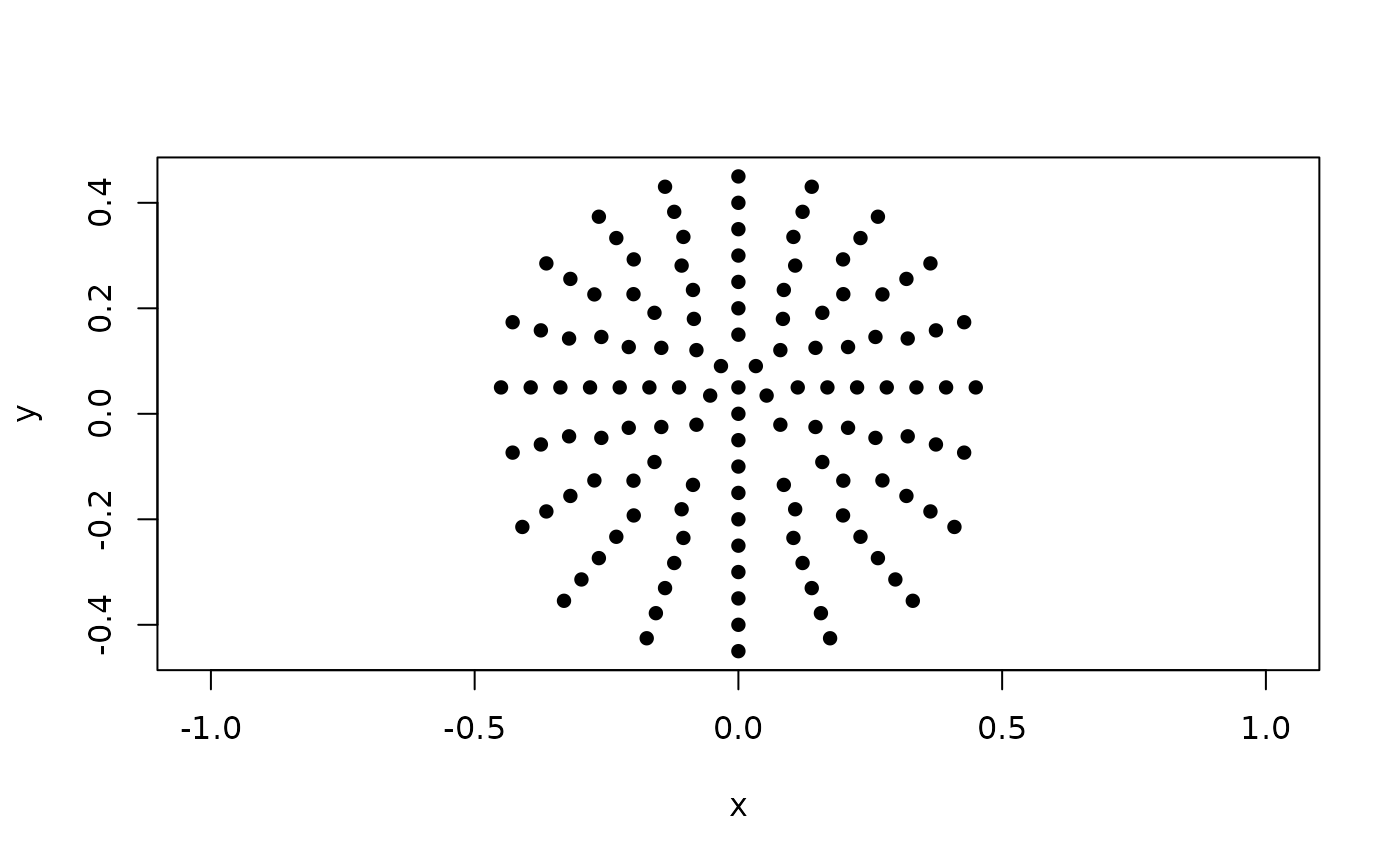
Coordinates of the spherical BioSemi system with 128 electrodes
biosemi128.RdA dataset containing the Cartesian coordinates of high-density EEG sensor positions of the BioSemi system in 3D space on an idealized spherical surface, along with their corresponding positions in 2D space. This template contains 128 electrode positions in the 3D space and for the 2D layout.
Usage
data("biosemi128")Format
A list with the following elements:
- D2
A tibble with 3 columns containing x and y coordinates and sensor labels (according to the BioSemi naming convention) in 2D.
- D3
A tibble with 4 columns containing x, y and z coordinates and sensor labels (according to the BioSemi naming convention) in 3D. See 'Details' for more information.
- ROI
A factor containing the name of the region to which the corresponding sensor belongs. The levels are: "central", "frontal", "occipital", "parietal", and "temporal". Sensors were assigned to anatomical regions based on their closest spatial proximity (3D Euclidean distance) to the standardized 10-05 system electrodes.
Source
The MNE-Python GitHub repository, https://github.com/mne-tools/mne-python/tree/main/mne/channels/data/montages The FieldTrip GitHub repository, https://github.com/fieldtrip/fieldtrip/tree/master/template/layout
Details
The axis orientation in the 3D case is as follows:
x-axis: left (-) to right (+),
y-axis: posterior (-) to anterior (+),
z-axis: inferior (-) to superior (+). Because this is an idealized spherical model, the origin (0, 0, 0) represents the geometric center of the sphere.
The coordinates originate from the MNE-Python (3D montage) and FieldTrip (2D layout) GitHub repositories.
References
BioSemi Headcaps: https://www.biosemi.com/headcap2.htm
Examples
# A simple plot of sensor coordinates from BioSemi 128 system spherical template as points in 2D
plot(biosemi128$D2[,1:2], pch = 16, asp = 1)