Plot boxplots of response times
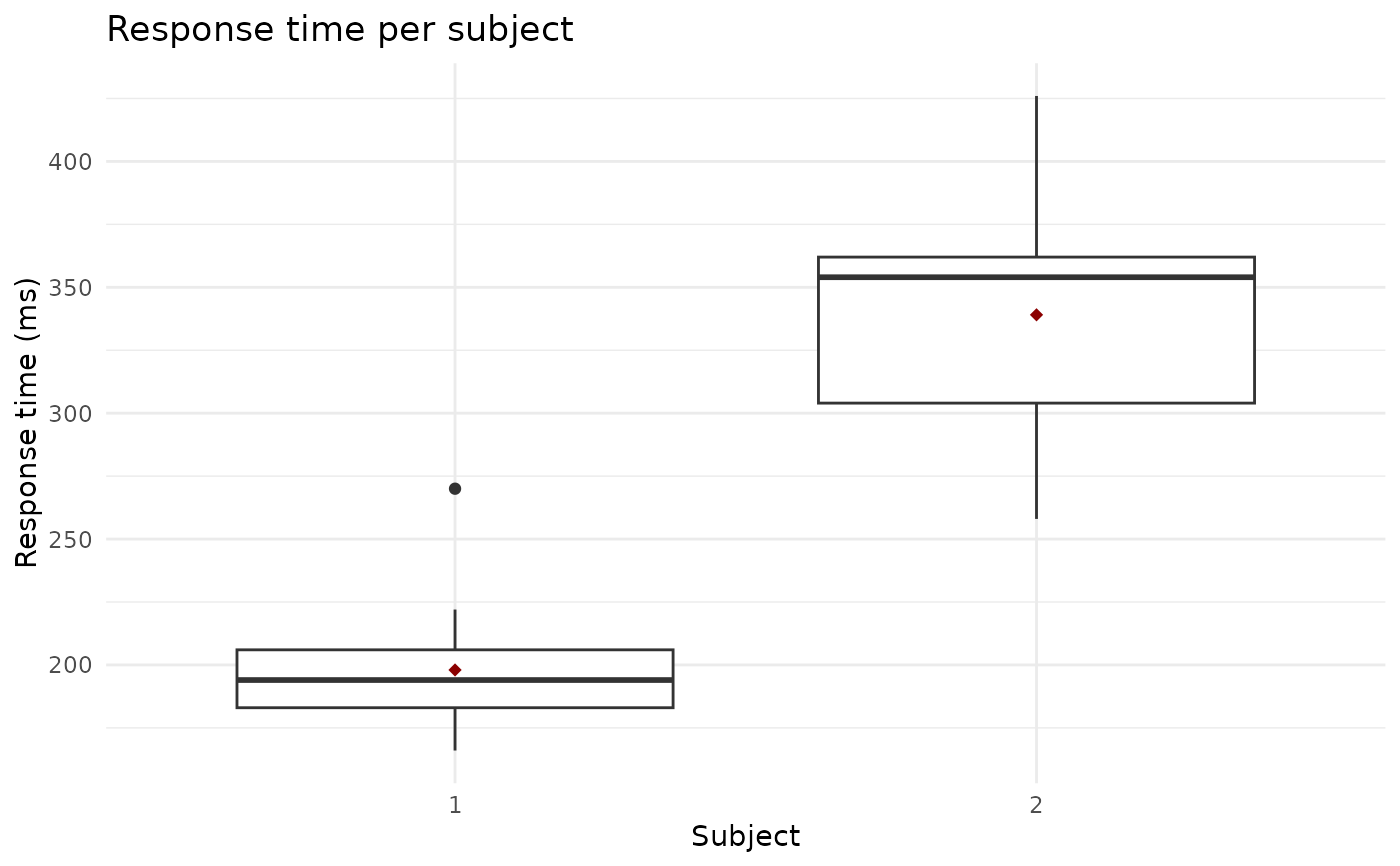
boxplot_rt.RdFunction for plotting interactive or static boxplots of response time in individual epochs for selected subjects. Both the static ggplot output and the interactive plotly output can be easily customized and edited, while the interactive plotly output additionally allows easy identification of the epoch numbers corresponding to outliers.
If the condition column is present in the input data, the boxplots are color-coded by condition.
Arguments
- data
A data frame or a database table containing response time data. Required columns:
subject,epoch,RT(value of response time in ms). An optionalconditioncolumn may be used to colour-code the boxplots.- subject
A vector with IDs of subjects to plot. If missing, boxplots are drawn for all available subjects in
data.- interactivity
Logical. Determines whether to render an interactive
plotlygraph (default) or a staticggplotgraph.
Examples
# Display interactive boxplots for both example subjects
boxplot_rt(rtdata)
# Display static boxplots for both example subjects
boxplot_rt(rtdata, interactivity = FALSE)
 # Interactive boxplots per subject divided by condition
# a) add condition column to data (just for example)
data_cond <- rtdata
data_cond$condition <- c(rep("a", 7), rep("b", 7), rep("a", 8), rep("b",7))
# b) plot boxplots (colour-coded by condition)
boxplot_rt(data_cond)
# Interactive boxplots per subject divided by condition
# a) add condition column to data (just for example)
data_cond <- rtdata
data_cond$condition <- c(rep("a", 7), rep("b", 7), rep("a", 8), rep("b",7))
# b) plot boxplots (colour-coded by condition)
boxplot_rt(data_cond)