Plot boxplots of EEG amplitude on epoch level
boxplot_epoch.RdFunction for plotting interactive or static boxplots of EEG amplitude in individual epochs within the chosen time interval. The function assumes data from a single subject and a single sensor.
Both the static ggplot output and the interactive plotly output can be easily customized and edited, while the interactive plotly output additionally allows easy identification of the epochs corresponding to outliers.
Usage
boxplot_epoch(
  data,
  amplitude = "signal",
  epoch = NULL,
  time_lim,
  title_label = NULL,
  use_latex = TRUE,
  interactivity = TRUE
)
Arguments
- data
A data frame or a database table with EEG dataset. Required columns:
epoch,timeand the column with EEG amplitude named as inamplitudeparameter.- amplitude
A character specifying the name of the column from input data with an EEG amplitude values. Default is
"signal".- epoch
A vector with numbers of epochs to plot. If missing, boxplots are drawn for all avaliable epochs in
data.- time_lim
A numeric vector with time range to plot.
- title_label
A character string specifying the title of the plot. Defaults to
NULLfor plot without title.- use_latex
A logical value indicating whether to use LaTeX formatting for the y-axis title. The default is
TRUE.- interactivity
Logical. Determines whether to render an interactive
plotlygraph (default) or a staticggplotgraph.
Details
The input data frame or database table must contain at least following columns:
epoch - a column with epoch numbers,
time - a column with time point numbers,
and a column with measured EEG signal values (or their averages) called as in amplitude.
Examples
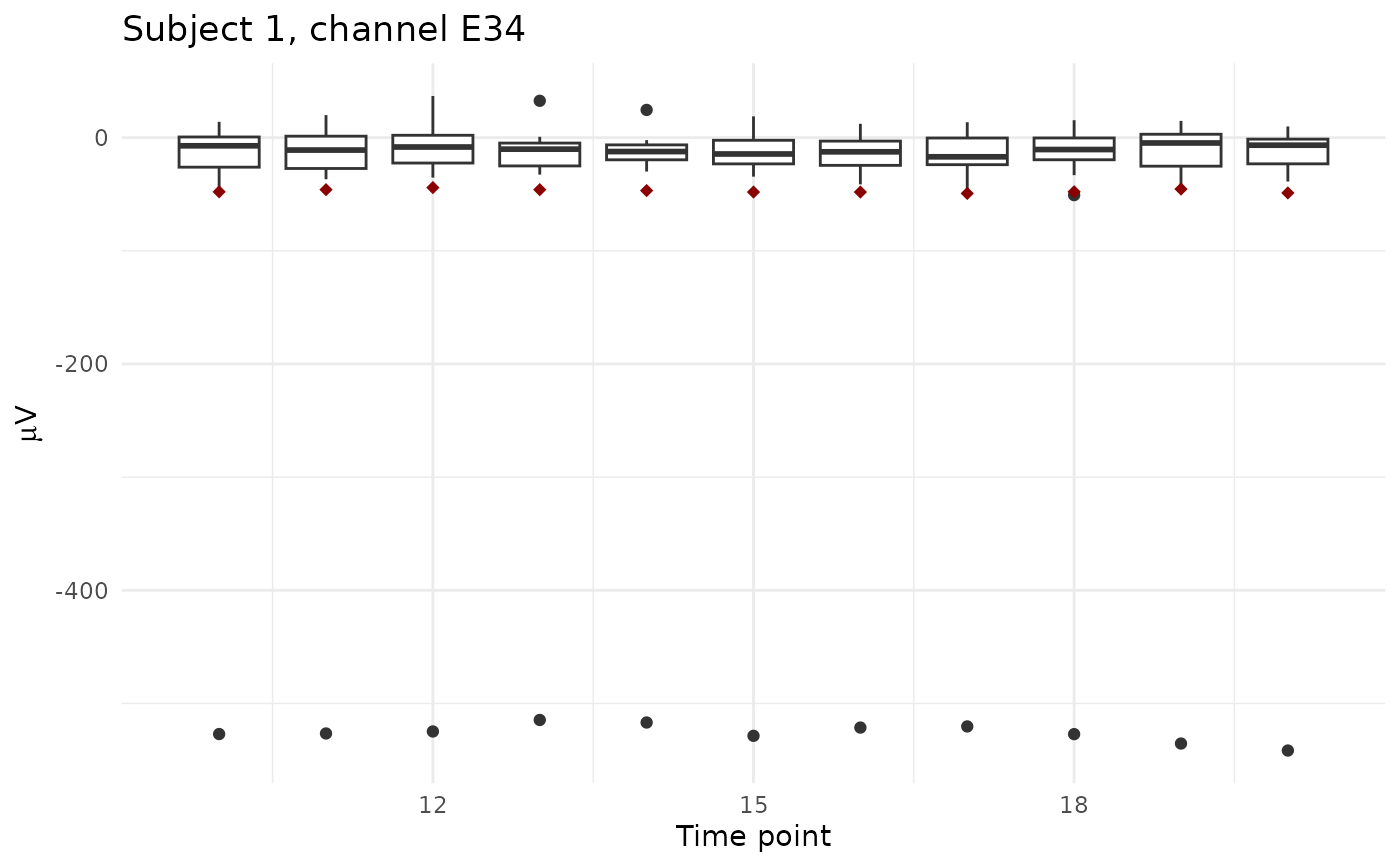
# Interactive boxplots of signal from channel E34 for subject 1 (health control)
# in time points 10:20
exampledata <- epochdata |>
pick_data(subject_rg = 1, sensor_rg = "E34")
boxplot_epoch(exampledata, amplitude = "signal", time_lim = c(10:20),
title_label = "Subject 1, channel E34")
# static version of the previous graph
boxplot_epoch(exampledata, amplitude = "signal", time_lim = c(10:20),
title_label = "Subject 1, channel E34", interactivity = FALSE)