Plot boxplots of EEG amplitude across subjects
boxplot_subject.RdFunction for plotting interactive or static boxplots of EEG amplitude across subjects for a single epoch and channel, within a specified time interval. The function assumes data from a single epoch and a single sensor.
Both the static ggplot output and the interactive plotly output can be easily customized and edited, while the interactive plotly output additionally allows easy identification of the subjects corresponding to outliers.
Usage
boxplot_subject(
  data,
  amplitude = "signal",
  subject = NULL,
  time_lim,
  title_label = NULL,
  use_latex = TRUE,
  interactivity = TRUE
)
Arguments
- data
A data frame or a database table with EEG dataset. Required columns:
subject,sensor,timeand the column with EEG amplitude named as inamplitudeparameter.- amplitude
A character specifying the name of the column from input data with an EEG amplitude values. Default is
"signal".- subject
A vector with IDs of subjects to plot. If missing, boxplots are drawn for all avaliable subjects in
data.- time_lim
A numeric vector with time range to plot.
- title_label
A character string specifying the title of the plot. Defaults to
NULLfor plot without title.- use_latex
A logical value indicating whether to use LaTeX formatting for the y-axis title. The default is
TRUE.- interactivity
Logical. Determines whether to render an interactive
plotlygraph (default) or a staticggplotgraph.
Details
The input data frame or database table must contain at least following columns:
subject - a column with subject IDs,
time - a column with time point numbers,
and a column with measured EEG signal values (or their averages) called as in amplitude.
Note: The function assumes that subject IDs are unique across the entire dataset. Using the same subject IDs in multiple groups may result in incorrect or misleading visualizations.
Examples
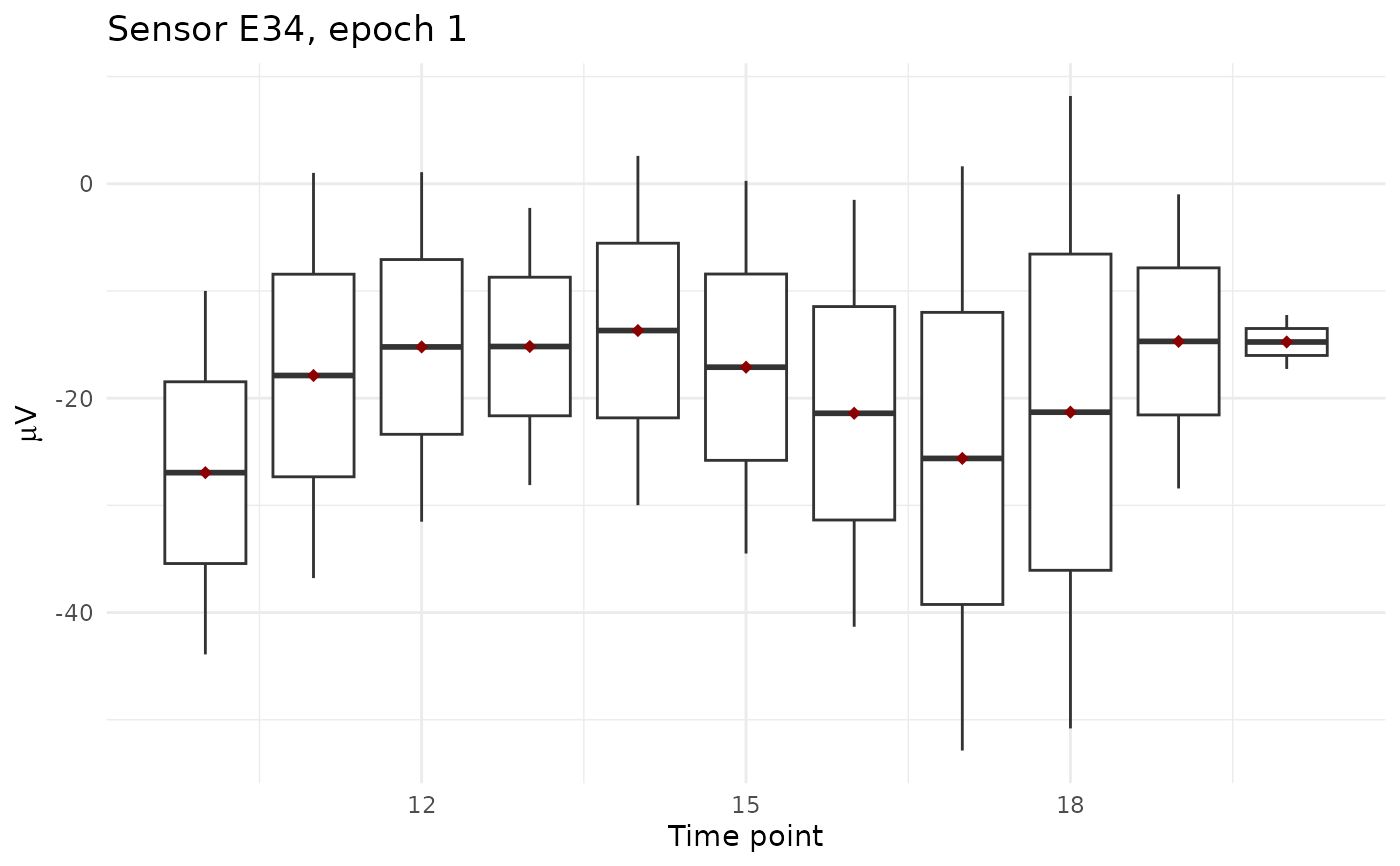
# Interactive boxplots of signal from channel E34 in epoch 1
# for both subjects in chosen time points
## Note: it has no statistical sense to make boxplot from only 2 observations, but
## larger example dataset is not possible due to size limit of the package
exampledata <- epochdata |>
pick_data(sensor_rg = "E34", epoch_rg = 1)
boxplot_subject(exampledata, amplitude = "signal", time_lim = c(10:20),
title_label = "Sensor E34, epoch 1")
# Static version of the previous graph
boxplot_subject(exampledata, amplitude = "signal", time_lim = c(10:20),
title_label = "Sensor E34, epoch 1", interactivity = FALSE)